New Zealand’s general election is currently set for September 19. Under ordinary circumstances, campaigning for the election and two referenda that will take place alongside would be heating up by now, but the country is three quarters of the way through a comprehensive level 4 lockdown.
The first question is whether the election should take place at all. Misgivings are beginning to emerge, including within the coalition government, but at the moment the answer is still a qualified yes.
Regardless of the precise date, New Zealand will be one of the first liberal parliamentary democracies to go to the polls since the outbreak of the COVID-19 pandemic – and it will be the most consequential election any of us have participated in.
Attempting to look five months out is a fool’s game at the best of times (which these are not), but elections are how we hold elected representatives to account. Unless the numbers of ill, hospitalised or dead New Zealanders take a sharp turn for the worse, the election is likely to go ahead.
If the numbers do worsen and Prime Minister Jacinda Ardern opts to delay the election, there are several ways in which the date can be pushed back, but it would still likely have to be held this year.
New Zealand’s three-year parliamentary term is entrenched in the Electoral Act, under which the last possible election date is on December 5, unless 75% or more of all MPs vote to extend the term of the 52nd Parliament.
What ever happens, it does not take much to imagine the logistical challenges that COVID-19 is posing for electoral agencies. Contingency planning for various scenarios is already underway, focused on identifying ways in which people can vote if they can’t get to a booth.
Postal voting is one option, but online voting on any significant scale is probably not, because of privacy risks and technical challenges.
Trust in government to make the right call
Ardern’s calm, measured and reassuring leadership during the COVID-19 crisis has attracted plaudits at home and away – as it did a year ago following the Christchurch mosque attacks.
Unlike other Western countries, New Zealand has a goal to eliminate COVID-19, rather than containing it, and after almost three weeks in lockdown, the number of people who have recovered from the illness now exceeds the number of new cases each day.
According to a recent Colmar Brunton poll, 88% of New Zealanders trust their government to make the right decisions about COVID-19 (well above the G7 average of 59%), and 83% trust it to deal successfully with national problems.
Ardern has fronted the mainstream media more or less daily, her Facebook Live appearance in a hoodie on a sofa received more views than New Zealand has people, and her communication has been crisp, clear and consistent. Go hard and go early. Stay home and save lives. Be kind.
But this is now. Come September, when people’s memories of this phase of the crisis have dulled and they are looking for a path through the social and economic damage COVID-19 is wreaking, a different political calculus will apply.
Few may hold Ardern directly responsible for the wreckage, but she will be held to account for her administration’s response to the challenges that lie ahead.
At that point the contest becomes one of ideas. The pandemic has dragged some venerable old political issues to the surface, chief among them the relationship between state and economy.
In New Zealand, there is broad support for the speed, decisiveness and competence with which the government and its officials have acted. The language of “government failure” has largely vanished and the importance of public institutions has become clear to everyone.
So has the extent to which markets rely upon the state. Except for the truest of believers in market forces, the argument that governments should get out of the way and give the private sector free reign has become untenable. For the time being.
It may seem unlikely that swathes of voters will embrace a return to unfettered markets but it is equally improbable that many will be clamouring for a permanent highly centralised state.
Trust in government is back in fashion for the moment in New Zealand, but we simply cannot tell how widespread support for a more active state will be once the COVID-19 health crisis has waned and the country faces the economic impacts.
New Zealanders talk a good fight about egalitarianism but we are remarkably tolerant of income and wealth inequality, health disparities and homelessness. Those things and more are waiting for us on the other side of COVID-19, and while we may yet come out of this crucible with a new social contract, it will need to be fought for.
That is why the 2020 election in New Zealand matters so much. Constitutionally, New Zealanders will be choosing a House of Representatives. Really, though, we will be choosing a future, because the next government will get to chart a course not just for the next parliamentary term but for a generation.
The good news is that after two years of big rises, wholesale electricity prices have fallen somewhat since mid-2017. The bad news is that prices are still much higher than they have been for most of the past 20 years. And the worse news is that we had better get used to these high prices.
A new Grattan Institute report, Mostly working: Australia’s wholesale electricity market, shows wholesale prices jumped from less than A$50 per megawatt hour (MWh) in 2015 to around A$100 per MWh in 2017. But it finds that most of this increase is the market working as it should. And it urges politicians to tell consumers a harsh truth: high electricity prices, well above A$50 per MWh, are here to stay.
The best thing our political leaders can do to keep a lid on electricity prices is to help create stable, bipartisan energy and climate-change policy. This will encourage new investment so Australian households can get low-cost, high-reliability, and low-emissions electricity.
For most of the past 10 years, Australia’s National Electricity Market (NEM) was oversupplied and powered by low-cost fuels in old power stations. Then things suddenly changed. Big, coal-fired power stations were closed – Northern in South Australia in 2016, followed by Hazelwood in Victoria in 2017. So supply was reduced, pushing prices up. At the same time, gas and coal prices rose rapidly, increasing running costs for electricity generators, which pushed up prices even further.
Our report shows about 60% of the wholesale price rises were caused by the
fundamental changes in supply. The NEM now needs new investment, particularly because more old generation assets, such as the Liddell power station, will be turned off in coming years as they reach the end of their working life. But the electricity produced by new generators of any type, including coal, is expected to cost more than the electricity produced by the old legacy assets.
Up to 40% of the wholesale prices rises of recent years were caused by the higher
input costs for generators. Coal and gas are two of the main inputs to electricity produced in the NEM (which covers Queensland, NSW and the ACT, Victoria, South Australia and Tasmania). Coal prices nearly doubled between 2015 and 2017; gas prices more than doubled. As a result, wholesale electricity prices increased so generators in the NEM could cover their costs of generating electricity. The direct cost of higher fuels to generators is up to A$4 billion a year.
Higher fuel costs for one generator can increase revenue for all generators, because all generators get paid the same spot price. If the generator that is setting the price at a given time needs a higher price to cover their costs, all other generators that produced electricity at that time also get a higher price, even if their costs have not risen. This encourages new investment in cheaper generation and is the market working as it should.
But a small amount – about 2% – of the wholesale price rises of recent years was caused by generators “gaming” the system. And that is certainly not the market working for consumers.
Big generators can game the system by using their market power to create artificial supply scarcity, which forces short-term price spikes. It is not illegal. Currently it is within the market rules for generators to bid up the price of their electricity until just 67 seconds before it is needed. By then it is often way too late for other generators to respond with lower prices. It’s a bit like Uber surge pricing but with no warning. Ultimately, the consumer cops the bill.
So what can be done?
Our report has three main suggestions.
First, politicians should be honest with the electorate, and explain why prices are unlikely to fall to the levels seen in 2015. Historic oversupply in the NEM is disappearing, gas prices are unlikely to fall back to where they were in the past, and new-build generation, including coal, is expected to need revenue well above A$50 per MWh to be viable.
Second, governments should finally provide Australia with stable energy and climate-change policy to make the transition to new generation technologies as smooth as possible. This would also reduce risk for new investment, which lowers financing costs and electricity prices.
The Greens tax policy, released on Wednesday, would hit high income earners and target corporate tax avoidance.
The Greens plan would bring in “a Buffett rule” to ensure higher income earners paid their fair share of tax by limiting deductions made by those earning more than A$300,000.
“This will force high income earners to pay a minimum rate of tax and stop those on high incomes from deducting their taxable income to zero,” the policy says. The move would raise $9.5 billion over the forward estimates.
A Buffett rule – that would put a floor under the tax the very wealthy had to pay – has support within the left of Labor but is not ALP policy. It has been opposed by opposition leader Bill Shorten and shadow treasurer Chris Bowen but may be raised by the left at the July ALP national conference.
In the Greens policy, another $14.3 billion would come from targeting property investors, with the capital gains tax discount phased out over five years, and negative gearing scrapped for future purchases and phased out for multiple properties.
Trusts would be taxed as large corporations, at a 30% rate, raising $3.8 billion over the forward estimates.
The policy says: “Despite what the Liberals say, Australia is a low taxing nation. It is the 8th lowest-taxed among the 35 OECD nations. Australia’s combined tax-to-GDP ratio is 28.2% for all levels of government in 2015. The OECD average is 34%.
“If Australia collected the same amount of tax as the average OECD nation then we would need to collect an additional $94 billion per year”.
Greens leader Richard Di Natale said that Australia had a “tax avoidance system” rather than a “tax system”.
“Big corporations and the super-rich have rigged the rules for themselves, and the old parties are too frightened to do anything about it.
“Big corporate donations, vested interests and the revolving door between parliament and big business has made it so that the wealthier corporations and individuals get richer and richer, while inequality just gets worse”.
The Greens oppose the corporate tax cuts and advocate changes to the petroleum resource rent tax, ending fossil fuel subsidies, mainly paid to multinational mining companies, and the introduction of a mining super profits tax at a rate of 40%.
They put forward measures to target corporate tax avoidance, saying it is estimated corporations avoid about $8 billion of tax a year.
Australia should cut its immigration intake, according to Tony Abbott in a recent speech at the Sydney Institute. Abbott explicitly cites economic theory in his arguments: “It’s a basic law of economics that increasing the supply of labour depresses wages; and that increasing demand for housing boosts price.”
But this economic analysis is too basic. Yes, supply matters. But so does demand.
And while migrants do live in houses, the federal government’s fondness for stoking demand and the inactivity of state governments in increasing supply are the real issues affecting affordability.
The economy isn’t a fixed pie
Let’s take Abbott’s claims about immigration one by one, starting with wages.
It’s true that if you increase labour supply that, holding other factors that affect wages constant, wages will decline. However, those other factors are rarely constant.
Notably, if the demand for labour is increasing by more than supply (including new migrants), then wages will rise.
This is a big part of the story when it comes to the relationship between wages and migration in Australia. Large migrant numbers have been an almost constant feature of Australia’s economy since the end of the second world war, if not earlier.
But these migrants typically arrived in the midst of economic growth and rising demand for labour. This is particularly true in recent decades, when we have had one of the longest periods of unbroken growth in the history of the developed world.
In our study of the Australian labour market, we found no relationship between immigration rates and poor outcomes for incumbent Australian workers in terms of wages or jobs.
Australia uses a point system for migration that targets skilled migrants in areas of high labour demand. Business is suffering in these areas. Migrants into these sectors don’t take jobs from anybody else because they are meeting previously unmet demand.
These migrants receive a higher wage than they would in their place of origin, and they allow their new employers to reduce costs. This ultimately leads to lower prices for consumers. Just about everybody benefits.
There’s an idea called the “lump of labour fallacy”, which holds that there is a certain amount of work to be done in an economy, and if you bring in more labour it will increase competition for those jobs.
But migrants also bring capital, investing in houses, appliances, businesses, education and many other things. This increases economic activity and the number of jobs available.
Furthermore, innovation has been shown to be strongly linked to immigration. In the United States, for instance, immigrants apply for patents at twice the rate of non-immigrants. And a large number of studies show that immigrants are over-represented in patents, patent impact and innovative activity in a wide range of countries.
We don’t entirely know why this is. It could be that innovative countries attract migrants, or it could be than migrants help innovation. It’s likely that the effect goes both ways and is a strong argument against curtailing immigration.
Abbott’s comments are more reasonable in the case of housing affordability because here all other things really are held constant. Specifically, studies show that housing demand is overheated in part by federal government policies (negative gearing and capital gains tax exemptions, for instance) and state governments not doing enough to increase supply.
Governments have responded to high housing prices by further stoking demand, suggesting that people dip into their superannuation, for instance.
In the wake of Abbott’s speech there has been speculation that our current immigration numbers could exacerbate the pressures of automation, artificial intelligence and other labour-saving innovations.
But our understanding of these forces is nascent at best. In previous instances of major technological disruption, like the industrial revolution, the long-run effects on employment were negligible. When ATMs debuted, for example, many bank tellers lost their jobs. But the cost of branches also declined, new branches opened and total employment did not decline.
In his speech, Abbott said that the government needs policies that are principled, practical and popular. What would be popular is if governments across the country could fix our myriad policy problems. Abbott identified some of the big ones – wages, infrastructure and housing affordability.
What would be practical is to identify the causes of these problems and address these directly. Immigration is certainly not a major cause. It would be principled to undertake evidence-based analysis regarding what the causes are and how to address them.
A lot of that has already been done, notably by the Grattan Institute. What remains is for governments to do the politically difficult work of facing the facts.
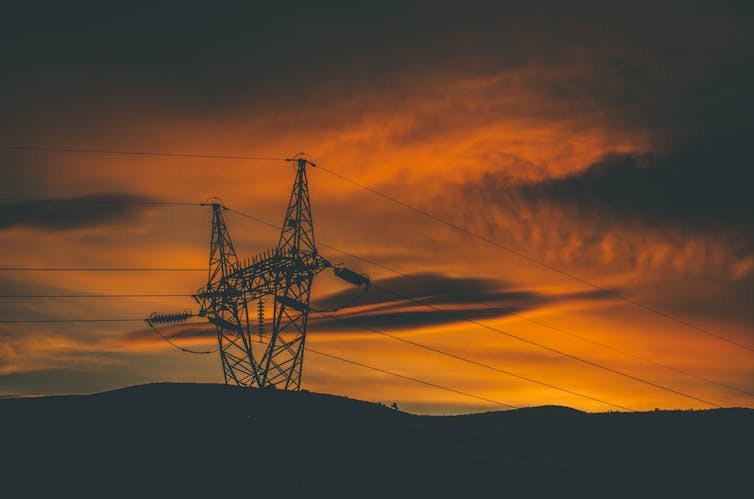
Politicians are told never to waste a good crisis. Australia’s electricity sector is in crisis, or something close to it. The nation’s first-ever statewide blackout, in South Australia in September 2016, was followed by electricity shortages in several states last summer. More shortages are anticipated over coming summers.
But for most Australians, the most visible impact of this crisis has been their ever-increasing electricity bills. Electricity prices have become a political hot potato, and the blame game has been running unchecked for more than a year.
Electricity retailers find fault with governments, and renewable energy advocates point the finger at the nasty old fossil-fuel generators. The right-wing commentariat blames renewables, while the federal government blames everyone but itself.
The truth is there is no silver bullet. No single factor or decision is responsible for the electricity prices we endure today. Rather, it is the confluence of many different policies and pressures at every step of the electricity supply chain.
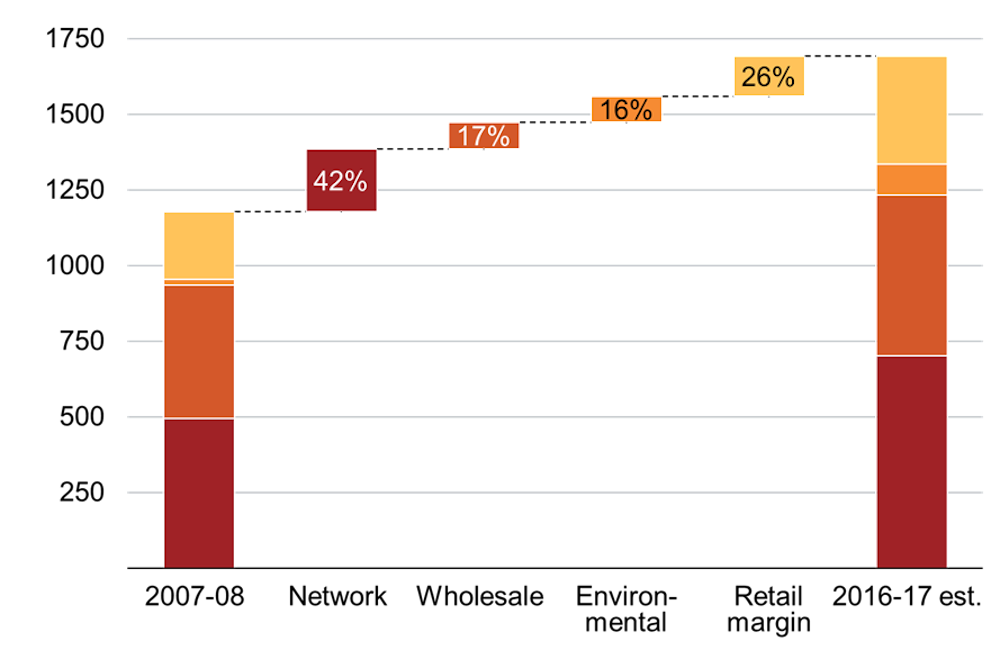
Four components make up your electricity bill. Each has contributed to this increase.
How your rising power bills stack up. ACCC, Author provided
The biggest culprit has been the network component – the cost of transporting the electricity. Next comes the retail component – the cost of billing and servicing the customer. Then there is the wholesale component – the cost of generating the electricity. And finally, the government policy component – the cost of environmental schemes that we pay for through our electricity bills.
Each component has a different tale, told differently in every state. But ultimately, this is a story about a decade of policy failure.
Network news
Network costs form the biggest part of your electricity bill. Australia is a big country, and moving electricity around it is expensive. As the graph above shows, network costs have contributed 40% of the total price increase over the past decade.
The reason we now pay so much for the network is simply that we have built an awful lot more stuff over the past decade. It’s also because it was agreed – through the industry regulator – that network businesses could build more network infrastructure and that we all have to pay for it, regardless of whether it is really needed.
Network businesses are heavily regulated. Their costs, charges and profits all have to be ticked off. This is supposed to keep costs down and prevent consumers being charged too much.
That’s the theory. But the fact is costs have spiralled. Between 2005 and 2016 the total value of the National Electricity Market (NEM) distribution network increased from A$42 billion to A$72 billion – a whopping 70%. During that time there has been little change in the number of customers using the network or the amount of electricity they used. The result: every unit of electricity we consume costs much more than it used to.
There are several reasons for this expensive overbuild. First, forecasts of electricity demand were wrong – badly wrong. Instead of ever-increasing consumption, the amount of electricity we used started to decline in 2009. A whole lot of network infrastructure was built to meet demand that never eventuated.
Second, governments in New South Wales and Queensland imposed strict reliability settings – designed to avoid blackouts – on the networks in the mid-2000s. To meet these reliability settings, the network businesses had to spend a lot more money reinforcing their networks than they otherwise would have.
Third, the way in which network businesses are regulated encourages extra spending on infrastructure. In an industry where you are guaranteed a 10% return on investment, virtually risk-free – as network businesses were between 2009 and 2014 – you are inclined to build, build, build.
The blame for this “gold-plating” of network assets is spread widely. Governments have been accused of panicking and setting reliability standards too high. The regulator has copped its share for allowing businesses too much capital spend and too high a return. Privatisation has also been criticised, which is slightly bizarre given that the worst offenders have been state-owned businesses.
Retail rollercoaster
The second biggest increase in your bill has been the amount we pay for the services provided to us by retailers. Across the NEM, 26% of the price increase over the past decade has been due to retail margins.
This increase in the retail component was never supposed to happen. To understand why, you must go back to the rationale for opening the retail sector to competition. Back in the 1990s, it was felt that retail energy was ripe for competition, which would deliver lower prices and more innovative products for consumers.
In theory, where competition exists, firms seek to reduce their costs to maximise their profits, in turn allowing them to reduce prices so as to grab as many customers as possible. The more they cut their costs, the more they can cut prices. Theoretically, costs are minimised and profits are squeezed. If competition works as it’s supposed to, the retail component should go down, not up.
But the exact opposite has happened in the electricity sector. In Victoria, the state that in 2009 became the first to completely deregulate its retail electricity market, the retail component of the bill has contributed to 36% of the price increase over the past decade.
On average, Victorians pay almost A$400 a year to retailers, more than any other mainland state in the NEM. This is consistent with the Grattan Institute’s Price Shock report, which showed that rising profits are causing pain for Victorian electricity consumers. Many customers remain on expensive deals, and do not switch to cheaper offers because the market is so complicated. These “sticky” customers have been cited as the cause of “excessive” profits to retailers.
But the new figures provided by the ACCC, which come directly from retailers, paint a different picture. The ACCC finds that the increase in margins in Victoria is wholly down to the increasing costs of retailers doing business.
There are reasons why competition might drive prices up, not down. Retailers now spend money on marketing to recruit and retain customers. And the existence of multiple retailers leads to duplications in costs that would not exist if a single retailer ran the market.
But these increases should be offset by retailers finding savings elsewhere, and this doesn’t seem to have happened. History may judge the introduction of competition to the retail electricity market as an expensive mistake.
Generational problems
So far, we have accounted for 65% of the bill increase of the past decade, and neither renewables nor coal have been mentioned once. Nor were they ever likely to be. The actual generation of electricity has only ever formed a minor portion of your electricity bill – the ACCC report shows that in 2015-16 the wholesale component constituted only 22% of the typical bill.
In the past year, however, wholesale prices have really increased. In 2015-16, households paid on average A$341 a year for the generation of electricity – far less than they were paying in 2006-07. But in the past year, that is estimated to have increased to A$530 a year.
Generators, particularly in Queensland, have been engaging in questionable behaviour, but it is the fundamental change in the supply and demand balance that means higher prices are here to stay for at least the next few years.
The truth is the cost of generating electricity has been exceptionally low in most parts of Australia for most of the past two decades. When the NEM was created in 1998, there was arguably more generation capacity in the system than was needed to meet demand. And in economics, more supply than demand equals low prices.
Over the years our politicians have been particularly good at ensuring overcapacity in the system. Most of the investment in generation in the NEM since its creation has been driven by either taxpayers’ money, or government schemes and incentives – not by market forces. The result has been oversupply.
Up until the late 2000s the market kept chugging along. Then two things happened. First, consumers started using less electricity. And second, the Renewable Energy Target (RET) was ramped up, pushing more supply into the market.
Demand down and supply up meant even more oversupply, and continued low prices. But the combination of low prices and low demand put pressure on the finances of existing fossil fuel generators. Old generators were being asked to produce less electricity than before, for lower prices. Smaller power stations began to be mothballed or retired.
Something had to give, and it did when both Alinta and Engie decided it was no longer financially viable to keep their power stations running. Far from being oversupplied, the market is now struggling to meet demand on hot days when people use the most electricity. The result is very high prices.
A tight demand and supply balance with less coal-fired generation has meant that Australia increasingly relies on gas-fired generation, at a time when gas prices are astronomical, leading to accusations of price-gouging.
Put simply, Australia has failed to build enough new generation over recent years to reliably replace ageing coal plants when they leave the market.
Is it renewable energy’s fault that coal-fired power stations have closed? Yes, but this is what needs to happen if we are to reduce greenhouse emissions. Is it renewables’ fault that replacement generation has not been built? No. It’s the government’s fault for failing to provide the right environment for new investment.
The right investment climate is crucial. Marcella Cheng/The Conversation, CC BY
The current predicament could have been avoided if we had a credible and comprehensive emissions reduction policy to drive investment in the sector. Such a policy would give investors the confidence to build generation with the knowledge about what carbon liabilities they may face in the future. But the carbon price was repealed in 2014 and replaced with nothing.
We’re still waiting for an alternative policy. We’re still waiting for enough generation capacity to be built. And we’re still paying sky-high wholesale prices for electricity.
Green and gold
Finally, we have the direct cost of government green schemes over the past decade: the RET; the household solar panel subsidies; and the energy-efficiency incentives for homes and businesses.
They represent 16% of the price increase over the past 10 years – but they are still only 6% of the average bill.
If the aim of these schemes has been to reduce emissions, they have not done a very good job. Rooftop solar panel subsidies have been expensive and inequitable. The RET is more effective as an industry subsidy than an emissions reduction or energy transition policy. And energy efficiency schemes have produced questionable results.
It hasn’t been a total waste of money, but far deeper emissions cuts could have been delivered if those funds had been channelled into a coherent policy.
The story of Australia’s high electricity prices is not really one of private companies ripping off consumers. Nor is it a tale about the privatisation of an essential service. Rather, this is the story of a decade of policy drift and political failure.
Governments have been repeatedly warned about the need to tackle these problems, but have done very little.
Instead they have focused their energy on squabbling over climate policy. State governments have introduced inefficient schemes, scrapped them, and then introduced them again, while the federal government has discardedpolicies without even trying them.
There is a huge void where our sensible energy policy should be. Network overbuild and ballooning retailer margins both dwarf the impact of the carbon price, yet if you listen only to our politicians you’d be forgiven for thinking the opposite.
And still it goes on. The underlying causes of Australia’s electricity price headaches – the regulation of networks, ineffective retail market competition, and our barely coping generators – need immediate attention. But still the petty politicking prevails.
The Coalition has rejected the Clean Energy Target recommended by Chief Scientist Alan Finkel. Labor will give no guarantee of support for the government’s alternative policy, the National Energy Guarantee. Some politicians doubt the very idea that we need to act on climate change. Some states have given up on Canberra and are going it alone.
We’ve been here before and we know how this story ends. Crisis wasted.
Australian Bureau of Statistics (ABS) data released this week as part of the Personal Safety Study (PSS) reveals 16% of Australian women have experienced partner violence.
The 2016 PSS was conducted across Australia and surveyed around 21,000 people about their experience of violence. The PSS was last run in 2012, and before that in 2005, so it’s possible to make some comparisons across time.
The statistics show a mixed picture. Overall, the proportion of Australians who report that they experienced violence in the past year has declined from 8.3% in 2005 to 5.4% in 2016.
However partner violence remains high, especially towards women.
Women were much more likely to experience physical violence from a previous partner than a current one. Around 2.9% of women reported violence by a current partner, while around 14.6% of women experienced violence by a previous partner. There has been little change in the partner violence figures since 2005.
In the last few years, significant resources have been devoted to changing attitudes towards domestic violence – so why aren’t the numbers going down?
One answer may be that broader attitudes towards women and relationships need to change and this takes a long time. Campaigns like Let’s Change the Story and The Line focus on creating the deep and long-lasting cultural change that’s needed but it’s probably still too early to see results.
Another answer might be that some people are changing, and using violence less. But as we talk more about domestic violence, it loses the stigma historically attached to it. As a consequence, more people are prepared to name it and report it. This keeps the figures stable.
The ABS statistics show that some women* report violence by their intimate partners after separation rather than during the relationship. Of the women who reported experiencing domestic violence, 92.4% were living with their partner and 7.6% were separated.
This is no surprise. Leaving the relationship may threaten an abuser’s sense of control and violence may be one tactic used in an effort to reassert control or punish the victim for leaving.
In 1990, Martha Mahoney coined the term “separation assault” in recognition of the phenomenon. Separation is now a well-known risk factor for heightened violence. In governmentdeath reviews, actual or intended separation is a characteristic of a high proportion of intimate partner homicides.
Risk assessment tools that police and support services use in safety planning now routinely identify separation as a key risk factor for further violence and death.
As we reduce the stigma of naming domestic violence we may see more women seek help. Annie Spratt/Unsplash
Notably, while the ABS statistics have remained relatively stable, calls on services have increased significantly over recent years. Applications for domestic violence protection orders in Queensland have jumped from 23,794 in 2012-13 to 32,221 in 2015-16 – a 26% rise.
Similarly in Victoria, 74,551 family violence and personal safety matters were heard by the Victorian Magistrates Court in 2015–16. This was a 27% increase since 2011–12.
In Queensland, reports to police of breach of domestic violence protection orders have more than doubled between 2012 and 2017 and these have also increased significantly in Victoria.
According to annual reports, calls for support to Queensland’s domestic violence support line, DVConnect, have tripled between 2012 and 2016. Safesteps, Victoria’s domestic violence support line, has seen a similar increase.
Given the ABS reports that figures on domestic violence remain relatively stable, why is there such an increase in requests for support and services?
The ABS statistics are collected through a survey and include questions about seeking help.
The increased numbers of applications for protection orders, reports of breach of those orders and increased calls to support services might suggest that people are increasingly willing to seek help in response to the violence they are experiencing.
Perhaps some are choosing to leave their violent partners. Again, this increase in help-seeking may be explained in part by a reduced stigma associated with domestic violence and the increased willingness of people to name it.
Another explanation might be that services are improving their understanding of domestic violence and are getting better at screening for domestic violence and making appropriate referrals.
Whatever the reason for them, the relative stability of the overall statistics in the ABS study leave no room for complacency. The figures remain too high.
As we reduce the stigma of naming domestic violence we may see more women seek help, and when they do they will often be placing themselves at serious risk. We need to continue to develop and resource robust responses to individual perpetrators and appropriate support for victims.
The National Sexual Assault, Family & Domestic Violence Counselling Line – 1800 RESPECT (1800 737 732) – is available 24 hours a day, seven days a week for any Australian who has experienced, or is at risk of, family and domestic violence and/or sexual assault.
* This article originally said higher number numbers of women reported violence by their intimate partners after separation than during the relationship. This has now been corrected. The article also been amended to reflect that the ABS survey included questions about help-seeking.
The preliminary report on energy prices released last week by the Australian Competition and Consumer Commission (ACCC) suggests that the consumer watchdog is concerned about almost every aspect of Australia’s electricity industry. It quotes customer groups who say electricity is the biggest issue in their surveys, and cites several case studies of outrageous price increases experienced by various customers.
The report is long on sympathy about the plight of Australia’s electricity users. But the true picture is even worse – in reality, the ACCC’s assessment of Australia’s energy prices compared to the rest of the world is absurdly rosy.
The ACCC quotes studies from the Electricity Supply Association and the Australian Energy Markets Commission (AEMC) to compare electricity prices in Australia with those in other OECD countries. But the ACCC’s comparison is based on two-year-old data, and badly underestimates the actual prices consumers are paying.
The AEMC’s analysis assumes all customers are on their retailer’s cheapest available offer. This is an obviously implausible assumption, and gives a favourable impression of the price that customers are paying.
As previously pointed out on The Conversation, the Thwaites review – which looked at customers’ actual bills – found that in February 2017 Victorians were typically paying A35c per kilowatt hour (kWh) – 42% more than the AEMC’s estimate. What’s more, we know that Victoria’s electricity prices are lower on average than those in South Australia, Queensland and New South Wales, and hence below the Australian average.
A part of this 42% gap – around 15% – is explained by the latest price increases that are not included in the ACCC’s comparison. But this still leaves a 27% gap between what the AEMC assumes and the evidence of actual prices.
This begs the question: why did the ACCC not recognise the widely known flaw in the AEMC’s analysis?
The real problem is overbuilt network infrastructure
The report estimates that rising network charges account for more of the price increase than all other factors put together. There is no doubt that network charges are a real problem at least in parts of Australia, although their significance relative to retailers’ costs is contested territory.
But why would distributors build far more network infrastructure than they need? And why have government-owned distributors built far more infrastructure than private ones, despite having no more demand?
The answer to this perplexing question is to be found in part in Australia’s “competitive neutrality” policy. This is Orwellian doublespeak for an approach that is neither neutral nor competitive.
Under this policy, government-owned distributors are regulated as if they are privately financed. This means that when setting regulated prices, the Australian Energy Regulator (AER) allows government distributors to charge their captive consumers for a return on their regulated assets, at the same level as if they were privately financed. That is despite the fact that private financing is much more expensive than government funding.
It’s no surprise that when offered a rate of return that far exceeds the actual cost of finance, government distributors have a powerful incentive to expand their infrastructure for a profit. This “gold-plating” incentive is a well-known in regulatory economics.
Regulators, the industry and their associations have explained higher spending on networks in a variety of ways: higher reliability standards; flawed rules; flawed forecasting of demand growth; and the need to make up for historic underinvestment.
But was there ever historic underinvestment? A 1995 article co-authored by the current AEMC chair concluded that distribution networks had been significantly overbuilt. That was more than two decades ago, government distributor regulated assets are at least three times bigger per customer now.
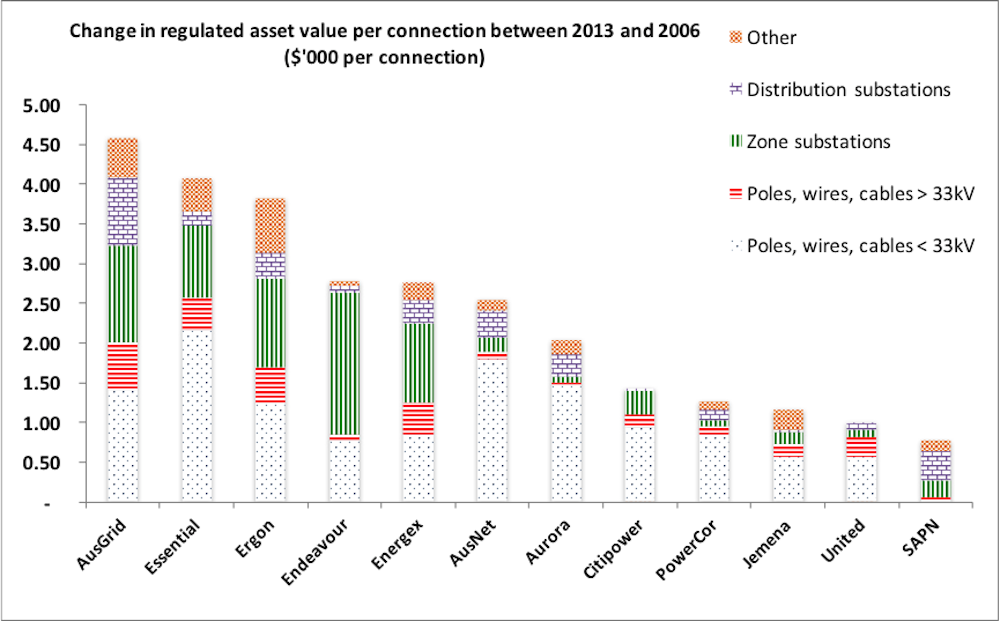
The chart below – based on data from the AER’s website – examines how the 12 large distributors that cover New South Wales, Victoria, Queensland and South Australia spent their money on infrastructure between 2006 and 2013. This period covers the last five-year price controls established by the state regulators, and the first control established by the AER. It was during this time that expenditure ballooned. The monetary amounts in this chart are normalised by the number of customers per distributor.
Distributor spending on infrastructure between 2006 and 2013. Author provided
The first five distributors from left to right (and Aurora) were owned by state governments and the others are privately owned. A clear pattern emerges: the government distributors typically built much more infrastructure than the private distributors. And the government distributors focused their spending on substations, which are much easier to build (or expand or replace) than new distribution lines or cables.
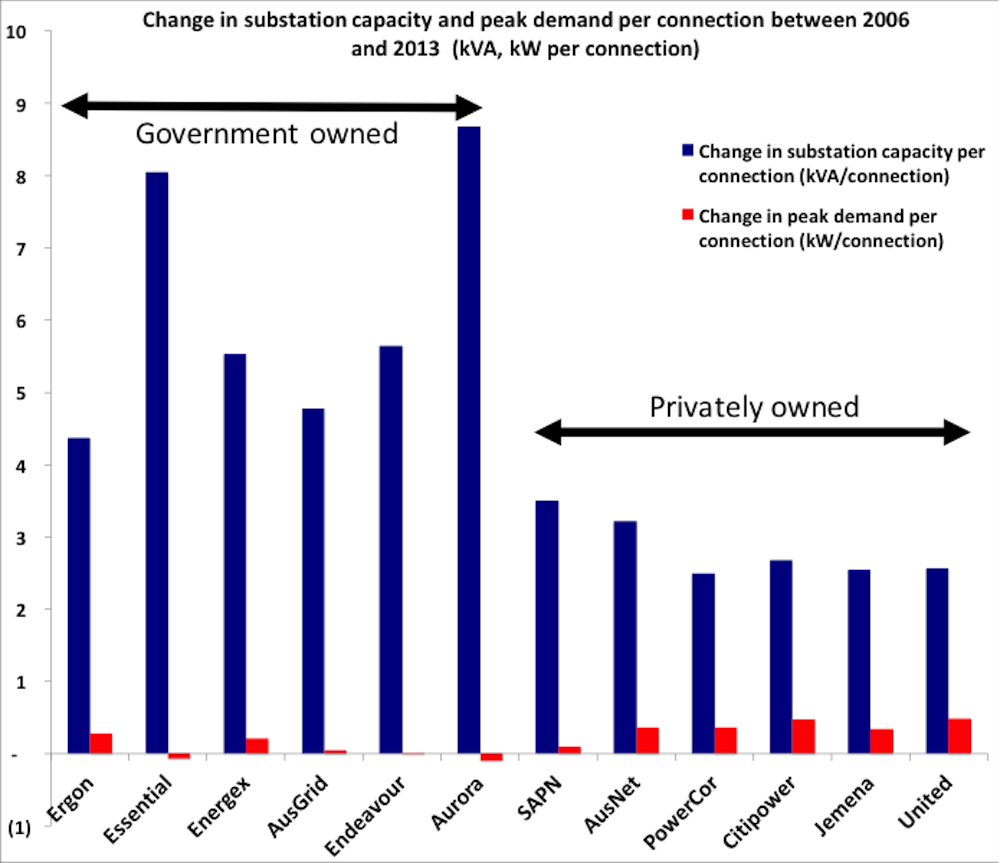
We also know that the distributors’ spending on substations far outstripped the increases in the peak demand on their networks. The figure below compares the change in the government and private distributors’ substation capacity (the blue bars) with demand (the red bars) over the period that most of the expenditure occurred. Again, the amounts have been normalised by number of customers.
Substation capacity versus peak demand between 2006 and 2013. Author provided
The gap in spending between government and private distributors is stark. It is also obvious that in all cases, but particularly for the government distributors, the expansion of substation capacity greatly exceeded demand growth – which hardly changed over this period (and is even lower now, per connection).
To put it in more tangible terms, as an average across the industry, peak demand between 2006 to 2013 increased by the equivalent of the power used by one old-fashioned incandescent light bulb, per customer. But government distributors expanded their substation capacity by more than one 100 light bulbs, per customer. The private distributors did relatively better, but still increased the capacity of their substations by the equivalent of about 30 light bulbs per customer.
My PhD thesis included econometric analysis that shows government ownership in Australia is associated with regulated asset values that are 56% higher than private distributors, and regulated revenues that are 24% higher, leaving all other factors the same.
To some, this evidence supports a “government bad, private good” conclusion. Indeed it was this line of argument that the Baird government in New South Wales used to justify its partial privatisation of two network service providers.
But in international comparisons of government and private distributors in the United States, Europe and New Zealand, no such stark differences are to be found. The huge disparity between government and private distributors is a peculiarly Australian phenomenon.
How we got here
This Australian exception originates in chronic policy and regulatory failure. As far back as 2011, the Australian Energy Market Commission (AEMC) heard a proposal that government distributors should earn a return closer to their actual cost of financing – a suggestion that would have reduced prices significantly and removed the incentive to gold plate.
In response, the AEMC said the regulations were consistent with the “competitive neutrality” policy. But this is not true: in the policy’s own words, it was designed to stop government businesses from crowding out competitors. Distributors are protected monopolies; they do not have competitors.
The AEMC also argued, somewhat bizarrely, that it was good economics for a regulator to assume that government distributors are privately financed.
This represents the triumph of an idealistic “normative” regulatory model in which regulators act on the basis of how the regulated entity should behave rather than how they actually behave.
But it would wrong to blame the AEMC alone for this failure. All of Australia’s key institutions and governments have agreed that government distributors should be regulated as if they are privately financed. For governments that own their distributors, this has been a wonderfully profitable fiction.
Therein lies much of the explanation for what is effectively, if I may call a spade a spade, a racket.
It is an indictment of Australia’s polity and so many of its economists that the 2011 Garnaut Climate Change Review stands alone, in a library of reviews, as stating this problem clearly. In fact, if you review last week’s report from the ACCC, you will not find a single distinction between the impact of government and private distributors.
And if you thought this was yesterday’s war, you would be wrong. Despite the mass of evidence, our regulators persist in the fiction that ownership and regulation should be independent of one another.
It is difficult not to lapse into despair about Australia’s energy policy morass. Despite the valiant attempts by many, a deeply entrenched culture of half-truths, vested interests, ideology and wishful thinking still characterises all too much of what emanates from the political and administrative leadership of this industry.
Some energy consumers – Prime Minister Malcolm Turnbull among them – will buy their way out of this problem through solar panels and batteries. But the poorest households and many business customers will increasingly be left carrying the can.
Australians are angry about electricity. Not unreasonably.
This article is part of a series Australia’s place in space, where we’ll explore the strengths and weaknesses, along with the past, present and the future of Australia’s space presence and activities.
Rockets, astronomy and humans on Mars: there’s a lot of excited talk about space and what new discoveries might come if Australia’s federal government commits to expanding Australia’s space industry.
But one space industry is often left out of the conversation: Earth observation (EO).
EO refers to the collection of information about Earth, and delivery of useful data for human activities. For Australia, the minimum economic impact of EO from space-borne sensors alone is approximately A$5.3 billion each year.
And yet the default position of our government seems to be that the provision of EO resources will come from other countries’ investments, or commercial partners.
You’ve almost certainly relied on EO at some point already today.
The wide range of government, industry and societal uses of Earth observation in Australia. Australian Earth Observation Community Coordination Plan 2026
EO describes the activities used to gather data about the Earth from satellites, aircraft, remotely piloted systems and other platforms. It delivers information for our daily weather and oceanographic forecasts, disaster management systems, water and power supply, infrastructure monitoring, mining, agricultural production, environmental monitoring and more.
Global positioning and navigation, communications and information derived from satellites looking at, and away from Earth are referred to as “downstream” space activities.
“Upstream” activities are the industries building infrastructure (satellites, sensors), launch vehicles and ground facilities for operating space-based equipment. In this arena, countries such as Russia focus on building, launching and operating satellites and space craft. Others (such as Canada, Italy, UK) target developing industries and government activities that use these services. The US and China maintain a balance.
Although we rely so heavily on downstream space activities in our economic and other operations, Australia invests very little in space: only 0.003% of GDP, according to 2014 figures.
Other countries have taken very proactive roles in enabling these industries to develop. Most government space agencies around the world invest 11% to 51% of their funds for developing EO capacity. These investments allow industries and government to build downstream applications and services from secure 24/7 satellite data streams.
In EO there are no comparable national programs or infrastructure, nor have we contributed to international capability at the same levels as these areas. This seems strange given:
our world leading status in applied research and extensive government use of these data as fully operational essential and critical information streams
there are now a number of well established and growing small companies focused on delivering essential environmental, agricultural, grazing, energy supply and infrastructure monitoring services using EO, and
Example of an information delivery service built from Earth observation data streams to deliver property level information to graziers and others land-holders (click to zoom for a clearer view). P Tickle, FarmMap4D, Author provided
Building Australia’s EO capacity
EO plays a vital role in many aspects of Australian life. Australia’s state and Commonwealth agencies, along with research institutions and industry have already built essential tools to routinely deliver satellite images in a form that can be developed further by private industry and delivered as services.
But our lack of a coordinating space agency adds a layer of fragility to vital EO operations as they currently stand.
This places a very large amount of Commonwealth, state and local government activity, economic activity and essential infrastructure at risk, as multiple recent national reviews have noted.
Although our private EO upstream and downstream industry capabilities are currently small, they are world leading, and if they were enabled with government-industry support in a way that the Canadian Space Agency, the European Space Agency/European Commission and UK Space Agency do, we could build this sector.
If Australia is to realistically participate in the “Space 2.0” economy, we need to act now and set clear goals for the next five, ten and 20 years. EO can be a pillar for this activity, enabling significant expansion of our upstream and downstream industries. This generates jobs and growth and addresses national security concerns.
That should be a win for all sectors in Australia – and we can finally give back and participate globally in space.
Data sources for figure “Proportion of space budget spent on different capacities”: NASA; ESA – here and here; JAXA; PDF report on China.
Stuart Phinn, Professor of Geography, Director – Remote Sensing Research Centre, Chair – Australian Earth Observation Community Coordination Group, The University of Queensland
The link below is to an article concerning high speed rail in Australia. In the light of the ‘slow speed’ broadband policy announced by the Coalition, I wonder if they have a take on high speed rail? Perhaps they might unveil a network of unsealed roads and the new birth of Cobb and Co? After all, there is only so much you can do with high speed rail.


You must be logged in to post a comment.