Australia was a model for protecting people from COVID-19 — and then we dumped half a million people back into poverty


http://www.shutterstock.com

Sharon Bessell, Australian National UniversityAs the pandemic swept the globe in 2020, Australia stood out as a model for how to contain the virus and support its citizens.

A year later, Australia is struggling with vaccination and has abandoned the measures it put in place in 2020 to support the most vulnerable.

The A$750 per week COVID disaster payment to Australians in jobs is as big as the biggest of last year’s JobKeeper payments. It has been extended to the casual workers employed for less than a year and visa holders who missed out last time.

And it’s being delivered direct to the recipients rather than via employers, some of whom appeared to have pocketed the money last time. So far, so good.

For the newly unemployed and people on parenting payments there’s an extra $200 per week — but only if they’ve lost more than eight hours’ per week work.

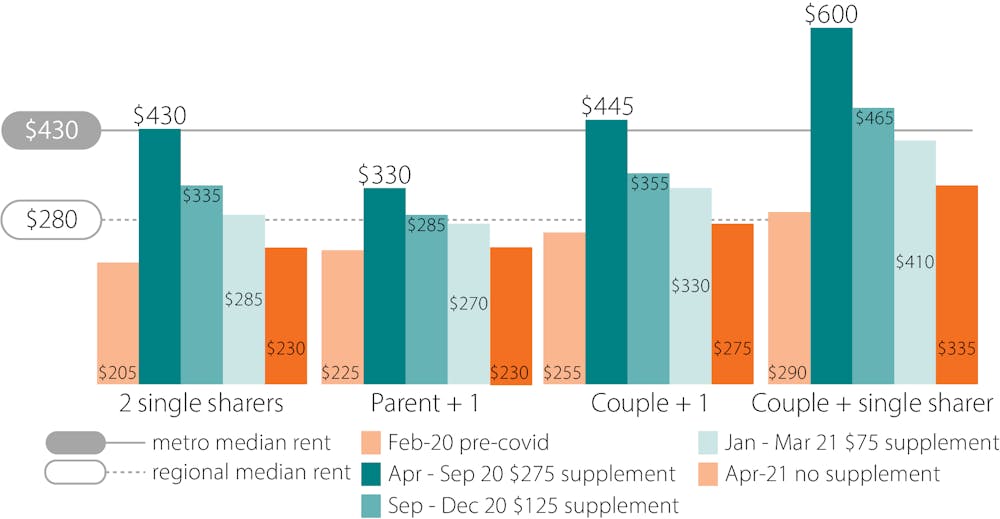
What’s missing is last year’s effective doubling of JobSeeker and related benefits for people who were already out of work: the $550 per fortnight add-on that lifted the payment up towards the poverty line.

An estimated 540,000 of the 720,000 adults locked down on such payments don’t get the $200 per week because they didn’t have paid work ahead of the lockdown.

They are unable to find it during the lockdown and have to live on $44 a day — well below the poverty line.

The COVID supplement changed lives

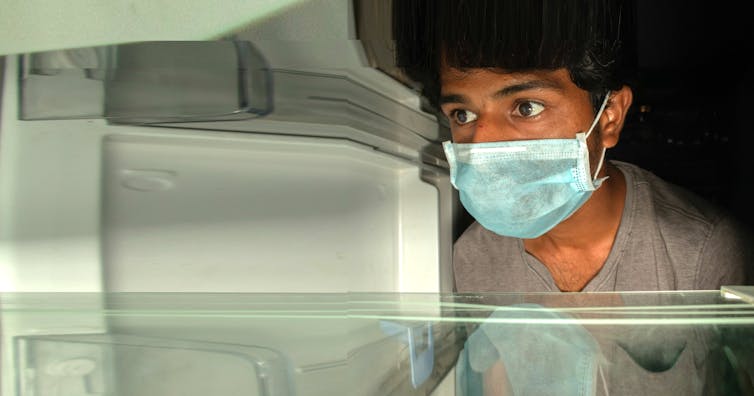
Last year the so-called coronavirus supplement made all the difference, allowing those families to buy essential items including food and medical care that were previously out of reach.

An online survey conducted by Swinburne University and the Australian National University found the money was used for basic needs and strategic expenditures to “improve their household’s long-term financial security”.

The Australian National University found poverty rates dropped markedly for couples with children, and even more for single parent households.


Read more:
What happens when you free unemployed Australians from ‘mutual obligations’ and boost their benefits? We just found out


Before COVID hit, the poverty rate in single parent households was 20.2%. In the absence of policy change and the advent of COVID-19 it would have climbed to 27.9%. The COVID stimulus payments cut it to just 7.6% in June.

A survey of single mothers found 88% suffered less anxiety. More than two-thirds (69%) reported being healthier as a result of being able to buy enough and healthier food.

So valued was the $550 per fortnight it sparked a website, 550 Reasons to Smile, showcasing stories of the changes it had wrought.

An old gas heater died and thankfully to the $550 supplement I was able to go and purchase a new one straight away to keep my new baby and 2 other children warm at night (one has severe croup)

We could afford a new phone. We are both in our early 60s and our best skill was hiding our poverty after our small business, our life, went bankrupt. We would skip meals before the grandchildren would visit to afford those treats.

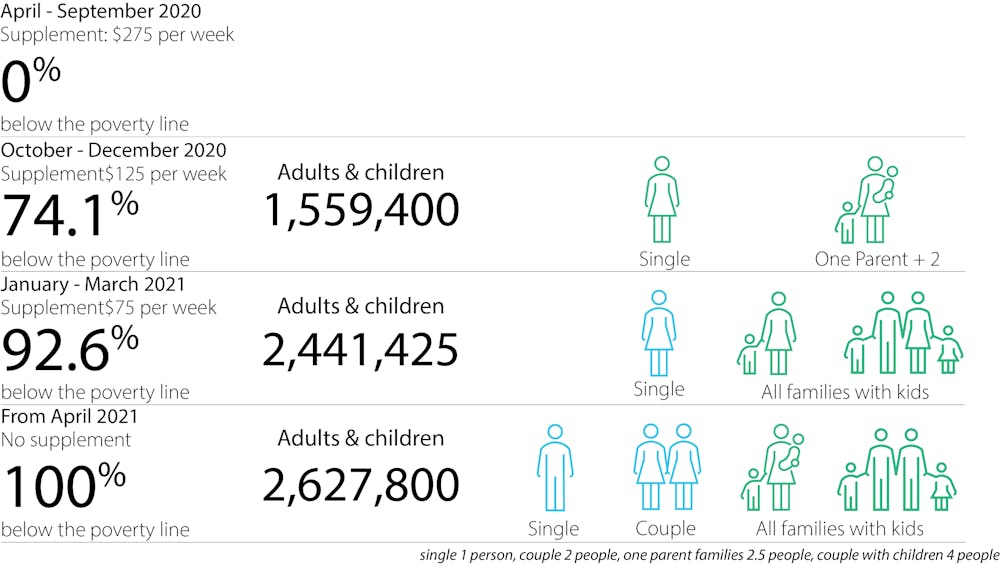
When the $150 per fortnight that remained of the coronavirus supplement after it had been phased down ended on March 28 this year, it was replaced by a permanent increase in JobSeeker and similar benefits of only $50 per fortnight.

It plunged hundreds of thousands of children back into poverty.

Toys and food matter to children

Prior to COVID-19, I led a research project with children aged between seven and 12. Two-thirds lived in locations identified by standard indicators as disadvantaged.

We gave children the time to raise issues that mattered to them. There was discussion about favourite and longed-for toys, games, and devices; the most fun parks and playgrounds; and the ups and downs of friendships.

Children go without things they need for school.
Yuganov Konstantin/Shutterstock

As the research unfolded and children felt more comfortable, they raised the challenges of not having enough money to meet the most basic needs.

Some had only one meal a day and not all were offered school breakfasts.

A nine-year-old boy described his neighbours as “good” and “always helpful”. He said they provided food when his family could not afford to buy it.

A common theme was the imperative to protect their parents by not asking for things they needed, including things for school.

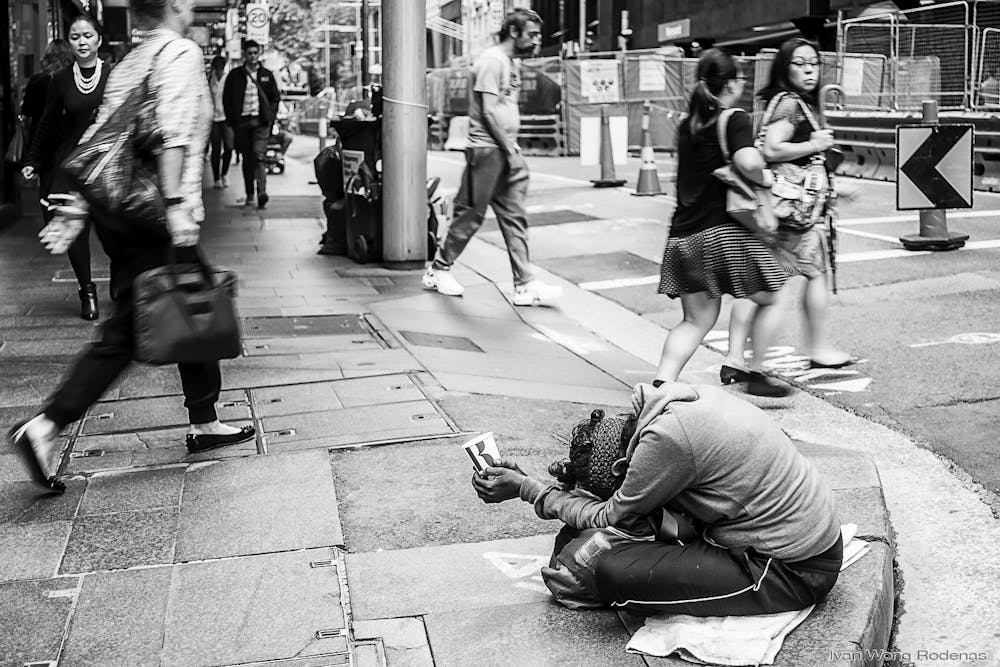
This is the reality of poverty — a reality to which too many Australian children are currently being abandoned.The Conversation

Sharon Bessell, Professor of Public Policy, Crawford School of Public Policy, Australian National University

This article is republished from The Conversation under a Creative Commons license. Read the original article.

At least 2.6 million people face poverty when COVID payments end and rental stress soars


Shutterstock

Simone Casey, RMIT University and Liss Ralston, Swinburne University of TechnologyMany Australians whose jobs were decimated by the COVID business shutdowns will soon be waking up to new income shocks and the prospect of rental stress. This is because people whose employers can’t afford to keep them on will suddenly lose more than A$300 per week when the JobKeeper scheme ends on March 28. Worryingly, this income shock will happen just days before the payment to people on the JobSeeker benefit is effectively cut by $100 per fortnight.

At that point, all income support recipients – more than 2.6 million people – will be below the poverty line and many will face extreme rental stress.


Read more:
$1 billion per year (or less) could halve rental housing stress


This income shock has been anticipated for some time, but what does it means for rates of rental stress, particularly in Victoria? Despite promising signs of recovery, Victorian jobs lost in the COVID-induced recession, such as in the hard-hit business tourism and live music industries, have not bounced back at the same rate as others.

What will happen to rental affordability?

To illustrate this point we have modelled housing affordability for single people who were on either the full-time or part-time JobKeeper rate. In this scenario, they could also get JobSeeker payments at a part-rate because of the temporary increase in the income-free threshold to $300. This made them eligible for Commonwealth Rent Assistance too.

The chart below shows the impacts on income and rental affordability when JobKeeper and Coronavirus Supplement payments end. Their incomes and the amount of rent they can afford are roughly halved.

Impacts of the loss of JobKeeper and Coronavirus Supplement on income and affordable rent.
Author provided

Full-time and part-time single workers were able to afford weekly rent of $265 and $245 respectively before the withdrawal of JobKeeper. Afterwards, affordable rent goes down to $115 per week. That’s about $110 less than the $450 median rent ($225 per person) for a two-bedroom share house in Melbourne.

Based on our earlier calculations, this leaves these renters with only $17.57 per day to meet basic costs. They have a lavish $3.57 per day more than they did before the pandemic to pay for food, utilities and job-seeking costs such as mobile phone plans and travel cards (A$4.40 a day in Melbourne).


Read more:
City share-house rents eat up most of Newstart, leaving less than $100 a week to live on


What is different now than for pre-COVID unemployment was that business shutdowns thrust people who had reliable earnings – and accompanying high rents and mortgages in metropolitan areas – onto JobSeeker and JobKeeper payments.

The chart below shows the change in rental affordability for a number of household types before the pandemic and during the Coronavirus Supplement stages (i.e. payments of $550, then $250, then $150).

Affordable rents by household types with supplement and without.

For example, when their income was highest during the $550 stage, two singles sharing could afford rent of $430 per week. Once the supplement ends and is replaced by the $25-a-week increase in JobSeeker payment, affordable rent declines to only $230 per week or $115 each.

Rental affordability for single-parent households is notable here because the COVID Supplement was payable to one person only. Once the supplement is withdrawn, they will again be disadvantaged relative to other households because they will not be receiving the increase in the JobSeeker payment.


Read more:
After COVID, we’ll need a rethink to repair Australia’s housing system and the economy


What sort of job losses can we expect?

It is hard to predict exactly how many people will lose their jobs when JobKeeper ends. What we do know is the economic recovery in Victoria has lagged behind the other states. We also know that at the end of December 2020 1.55 million people were on JobKeeper and a large proportion of them (626,000) were in Victoria.

Economist Jeff Borland conservatively estimates national job losses could range between 125,000 and 250,000. It is reasonable to expect as many as half of these could be in Victoria.

Our analysis also shows there are worrying signs that the economic recovery celebrated in the January labour force data was not sustained in February. The latest data provided to a Senate inquiry into COVID-19 show JobSeeker recipients increased by 7,267 between January and February. The increase in Victoria could be attributed to the temporary Christmas retail boom, but in states like New South Wales and Queensland claims decreased slightly.

While fewer people will lose their jobs in other states than in Victoria when JobKeeper is withdrawn, they are not immune to this income shock. We created the chart below to show the overall scale of the coming problem of rental stress when the fortnightly $150 Coronavirus Supplement disappears and is replaced by the $50 JobSeeker increase.

Households and people on income support falling under poverty line as COVID supplement reduces (based on DSS data February 2021)

Once the supplement reduced to $250 per fortnight, singles and single parents with two children were below the poverty line. When it was reduced to $150, the number of household types in poverty increased again. From April 1, all income support recipients – covering more than 2.6 million people including children – will be waking up to poverty and the prospect of extreme rental stress.

What can be done to avoid this?

So how can governments prevent people from falling off the rental cliff? It is unlikely to be achieved by introducing cut-price flights to Far North Queensland.

A new range of strategies will be needed. These include options advocated by ACOSS and others to increase the maximum rate of Commonwealth Rent Assistance by 50%, increase the JobSeeker base rate above the poverty line and introduce rental stress grants targeted at individuals who need help.

Over the longer term, there is also a need to adopt strategic approaches to increase the supply of affordable rental housing such as those recommended by researchers at the Australian Housing and Urban Research Institute (AHURI).The Conversation

Simone Casey, Research Associate, Future Social Service Institute, RMIT University and Liss Ralston, Adjunct associate, Swinburne University of Technology

This article is republished from The Conversation under a Creative Commons license. Read the original article.

Winding back JobKeeper and JobSeeker will push 740,000 Australians into poverty


lakshmiprasada S/Shutterstock

Ben Phillips, Australian National University; Matthew Gray, Australian National University, and Nicholas Biddle, Australian National University

Australian National University calculations suggest JobKeeper and the boosted JobSeeker payment have saved about 2.2 million people from poverty.

It’s a remarkable outcome without precedent in Australia.

JobKeeper was set at A$1,500 per fortnight and the Coronavirus Supplement was set high enough to double JobSeeker and associated payments, increasing them to about $1,115 per fortnight.

Both are well above the poverty line, which according to our modelling is around $816 per fortnight.

From the end of September both will be cut. JobKeeper will fall to $1,200 per fortnight for those who previously worked 20 or more hours per week and to just $700 for those who previously worked less than 20 hours per week.

The payment to people on JobSeeker and related benefits will fall to $815.

Beyond December, JobKeeper will fall to $1,000 and $650 per fortnight and the Coronavirus Supplement will end, returning JobSeeker to $565.70 per fortnight.

Three quarters of a million more

Our estimates suggest that by themselves these changes will push an extra 740,000 Australians into poverty, lifting the total number in poverty from from 1.1 million to 1.84 million.

Partly offsetting this, the improvement in the economy forecast in the July Economic and Fiscal Update should it be realised would cut the number of Australians in poverty by about 140,000.

Treasurer Frydenberg said the payment he intends to withdraw would help with groceries.

These numbers tell us two important things.

One is that the Newstart unemployment benefit (now called JobSeeker) was too low.

Treasurer Josh Frydenberg seemed to acknowledge this when he announced the doubling in March, saying it would allow unemployed people to “meet the costs of their groceries and other bills”.

The other is that without (and even with) JobKeeper, many, many more people would have been pushed on to it.

We define poverty an equivalised household income of less than half the median household income.

What it would do to the poverty gap

We define the “poverty gap” as the total difference in income between those households below that poverty line and the poverty line.

Prior to COVID-19 it was A$5.9 billion.

Should the unemployment rate stay at its present 7.5% after JobKeeper is withdrawn and JobSeeker returned to normal we expect it to climb to $6.5 billion.

Should it linger at the 10% forecast by the Reserve Bank, we expect it to climb to $6.9 billion.


Read more:
The coronavirus supplement is the biggest boost to Indigenous incomes since Whitlam. It should be made permanent


It’s in all of our interests to minimise it for any given level of government support.

The ANU Centre for Social Research and Methods has developed an algorithm for calculating the optimal mix of government supports to achieve a range of policy goals including minimising poverty.

The mix it suggests would cut the poverty gap from $6.5 billion to $5.6 billion under the 7.5% unemployment scenario and from $6.9 billion to 5.8 billion under the 10% unemployment scenario.

How to minimise the damage

If the total level of welfare expenditure were to remain unchanged on pre-JobKeeper and Coronavirus supplement settings, the single JobSeeker would be increased substantially from $551 to $821 per fortnight and the age pension single rate from $902 to $915 per fortnight.

The increases would be offset by reductions in the Parenting Payment from $770 to $737 per fortnight (single), Family Tax Benefit Part A for children under 13 years of age from $218 to $154 per fortnight and Rent Assistance from $137 to $131 per fortnight.


Read more:
When the Coronavirus Supplement stops, JobSeeker needs to increase by $185 a week


We have also modelled the optimal setting for a 20% increase in government support and a 20% cut.

What our algorithm proposes wouldn’t eliminate poverty (it would cut it by between 14% and 15%) but it would enable to the government to achieve a lot without spending more money.

An essential part of whatever solution it adopts has to be an increase in JobSeeker. Without it an extra 740,000 Australians will be in poverty.The Conversation

Ben Phillips, Associate Professor, Centre for Social Research and Methods, Director, Centre for Economic Policy Research (CEPR), Australian National University; Matthew Gray, Director, ANU Centre for Social Research and Methods, Australian National University, and Nicholas Biddle, Professor of Economics and Public Policy, ANU College of Arts and Social Sciences, Australian National University

This article is republished from The Conversation under a Creative Commons license. Read the original article.

Why Australia’s homelessness problem is getting worse, despite a rise in housing stock


Rachel Ong, Curtin University and Gavin Wood, RMIT University

New housing supply is simply not expanding affordable housing opportunities for the poor in a way that reduces the homelessness count. We argue that this is due to certain barriers that prevent new supply from filtering down to low-income groups.

Politicians and economists often claim a housing supply crisis is to blame for the lack of affordable housing in Australia. They say increases in housing stock are failing to keep pace with population growth.

In a 2017 address to the Australian Housing and Urban Research Institute, Treasurer Scott Morrison said:

… for certain Australian households, housing affordability is an issue regardless of where they live due to economic reasons … However, in Sydney and Melbourne where supply has failed to keep pace with rising demand, the problem is far more acute… The principal cause of declining housing affordability is the failure of housing supply to adjust to increased demand…

Yet housing approval data from the Australian Bureau of Statics show the growth in housing stock has actually outpaced rates of population increase in all Australian capital cities.

https://datawrapper.dwcdn.net/WGWnh/1/

Between 2005-06 and 2014-15, housing stock has expanded by over 22% while population growth has lagged behind at 19%. Despite this, median residential property prices nearly doubled in the same period.

How it should work in theory

Increasing housing stock only works to make housing more affordable if certain filtering processes occur. This is how it looks if the number of new homes increases while the number of households stays fixed or increases at a slower pace.

Those in higher-income households may wish to upgrade to a newer, more expensive house. The established home they vacate would be more appealing to other households if it falls in price. This would then make it affordable to a middle-income household. And the home this middle-income household will vacate would then also fall in value and become affordable for a lower-income household.


Read more:
Australia’s almost a world leader in home building, so that isn’t a fix for affordability


Eventually, affordable housing opportunities would trickle down to the homeless, and the homelessness count would decline. But, in Australia, homelessness is on the rise. Back in 2006, fewer than 90,000 people were homeless. Within a decade, that number has climbed by nearly one-third, to more than 116,000 people – a 10% increase.

The number of homeless people in NSW has increased more than any other state.
Ivan Wong Rodenas/Flickr, CC BY

New South Wales has fared the worst. The number of homeless people in NSW has soared by 70% between 2006 and 2016. With the exception of the Northern Territory, all other states and territories witnessed an increase in homelessness in this period.

So, despite the rise in housing stock, most states and territories have failed to contain, never mind reverse, the rise in homelessness over the last decade. Why are the filtering processes not working?

Barriers to affordability

Deregulation of Australian financial markets and tax concessions have combined to make residential property an attractive investment, especially for higher-income households. So a higher-income earner would gain an additional property rather than swapping one for the other and leaving the vacated one affordable for the next in line.

And if a substantial share of new housing is being purchased as holiday homes or investments, this can stifle the trickle down of affordable housing opportunities.

The recent growth in net overseas migration is a likely barrier as well. Between 2004 and 2015, net overseas migration climbed by 30%, from 138,800 to 181,050. This has outstripped the 22% housing stock growth rate over roughly the same period.


Read more:
Housing affordability stress affects one in nine households, but which ones are really struggling?


While migration is included in overall population numbers, in this case, the houses migrants are vacating to move to Australia remain in their home country. So this doesn’t contribute to the filtering process.

Transaction costs (mainly high stamp duties) can deter people from trading up, or downsizing. Transaction costs are a drag on resident movements and suppress housing stock turnover.

Finally, land and building regulations can play a role. Elderly people who may wish to downsize from a family home to an apartment usually want to live in the same neighbourhood. Yet planning interventions may prevent the construction of units in the suburbs downsizers would prefer.

The ConversationUntil these barriers are lowered, simply increasing new housing supply cannot be the silver bullet that fixes homelessness and the housing affordability concerns of the Australian population.

Rachel Ong, Professor of Economics, School of Economics and Finance, Curtin University and Gavin Wood, Emeritus Professor of Housing and Housing Studies, RMIT University

This article was originally published on The Conversation. Read the original article.

Homeless numbers will keep rising until governments change course on housing


Gavin Wood, RMIT University; Guy Johnson, RMIT University; Juliet Watson, RMIT University, and Rosanna Scutella, RMIT University

Ten years ago the Australian government launched a National Partnership Agreement on Homelessness (NPAH). It injected A$800 million into homelessness services and A$300 million to build 600 new homes for people experiencing homelessness. It was later announced that another A$400 million would be available under the National Affordable Housing Agreement (NAHA) to build new housing and supported accommodation for the homeless. Total recurrent expenditure (at 2016-17 prices) on homelessness services has increased by 28.8%, from A$634.2 million in 2012-13 to A$817.4 million in 2016-17.

But despite this, the number of people experiencing homelessness and the rate of homelessness have both increased. Our research points to problems in the public housing system as one of the more important causes of these increases.

According to census figures released on Wednesday by the Australian Bureau of Statistics (ABS), the number of homeless people in Australia has risen by 14% to 116,427. The rate of homelessness has increased from 47.6 people per 10,000 of the population in 2011, to 49.8 per 10,000 now. (The ABS defines homelessness here.)

There is some good news: the numbers of Indigenous homeless and homeless children and youth (aged 12-18) have declined by 26%, 11% and 7% respectively since 2011. But on the downside, increases are particularly pronounced in New South Wales (where the homelessness rate rose by 27% and among people aged over 65 (by just over 30%) and overseas-born migrants (by 40%).


Read more:
More and more older Australians will be homeless unless we act now


Why are we still going backwards?

Changes in Australian housing and welfare systems and wider social and economic developments appear to have more than offset any benefits from the NPAH and NAHA. Our research sheds some light on the role played by Australia’s housing system. Using the internationally recognised and unique Journeys Home longitudinal survey, we find that public housing is the most important factor in preventing homelessness among vulnerable people.

Public housing is particularly effective because it is affordable. It has also traditionally offered a long-term refuge for precariously housed people. This is because public housing leases provide the benefits of security of tenure commonly associated with home ownership.

It is perhaps no accident that NSW was one of the first states to introduce fixed-term tenancies in public housing. This eroded one of the major attributes of tenure, in a state that has seen relatively large increases in homelessness numbers.

The empirical evidence also suggests that community housing fails to provide the same protection for people at risk of homelessness. While community housing is affordable, the security of tenure is weaker, which may explain these findings.

Despite such evidence, the stock of public housing continued to decline between the 2011 and 2016 censuses. State government-initiated transfers of stock to the community housing sector accelerated this trend. In 2013 Australia had a public housing stock of 325,226 dwellings. This declined by 3.2% to 314,864 usable dwellings in 2017.


Read more:
Australia needs to reboot affordable housing funding, not scrap it


Where are the additional homeless coming from?

One of the more alarming changes is a sharp increase in the number of homeless people over 65. This partly reflects Australia’s ageing population. However, the increase is such that the elderly’s share of the total homelessness count has also risen.

Furthermore, our research suggests that this trend could become protracted. This is because the homeless elderly have much less chance of escaping into formal housing than younger people experiencing homelessness. We have little understanding of the reasons for this, but gaps in service provision to the aged could be partly responsible.

The other group who feature prominently among the homeless are overseas migrants. They now make up 46% of the homeless, despite representing just 28% of the Australian population. The number of homeless overseas-born migrants has soared by 40% since the 2011 Census, from 38,085 to 53,606 people.

It turns out that homeless overseas-born migrants are concentrated among those living in severely overcrowded dwellings – a little over half of those living in these conditions were born overseas. We know little about these homeless people. Discrimination could be a factor, though some characterise this group as students living in group households who should not be considered homeless. But this is speculation and further study is certainly required.


Read more:
Ghost-hunting: will the census reveal the true scale of homelessness in Australia?


In view of the latest census results, it is clear to us that governments need to reassess their approach to what is turning into an intractable social problem.

We do not deny that situational factors, such as drug abuse, domestic violence and so forth, are important here. But equally, there is strong evidence that structural problems in our housing market are a significant cause of growth in the numbers of homeless people.

The ConversationUntil these problems are resolved, service provision and support will remain a band-aid masking deeper social and housing system issues.

Gavin Wood, Emeritus Professor of Housing and Housing Studies, RMIT University; Guy Johnson, Professor, Urban Housing and Homelessness, RMIT University; Juliet Watson, Lecturer, Urban Housing and Homelessness, RMIT University, and Rosanna Scutella, Senior Research Fellow, Centre for Applied Social Research, RMIT University

This article was originally published on The Conversation. Read the original article.

Older people now less likely to fall into poverty


File 20171211 27686 1xnrbs9.jpg?ixlib=rb 1.1
The incidence of poverty among people over 65 is decreasing in part because of increased labour force participation.
Col Ford and Natasha de Vere/Flickr, CC BY-SA

Guyonne Kalb, University of Melbourne

The risk of people past retirement age falling into poverty is now decreasing. There has been a substantial improvement compared to 15 years ago, when the incidence of poverty among the elderly was 32.4%.

People past retirement age are much more at risk of poverty compared to people of other ages. In 2014, 23% of people over 65 were identified as experiencing poverty, while among the general population this was 10.1%.

If we look at poverty in older age using three alternative, well-established, definitions: the Henderson Poverty Line, the OECD 50% poverty line and the OECD 60% poverty line, they all lead to very similar conclusions.


Read more: How we could make the retirement system more sustainable


The OECD 50% poverty line is defined as 50% of median household equivalent disposable income. Equivalised household income allows for differences in household composition, like the number of adults and children who live in the household. It therefore makes income comparable between households of different sizes. Someone is counted as poor if their equivalised disposable household income falls below this poverty line.

Applying this to data from the Household, Income and Labour Dynamics Australia (HILDA) survey shows clear differences between ages. There’s a much larger incidence of poverty among people over 65, as well as a larger decrease in the poverty rate among those over 65.

Between 2000 and 2014, the prevalence of income poverty among older people declined by more than 9 percentage points, well above the decline of other age groups.

https://datawrapper.dwcdn.net/rbsb8/5/

There are a number of reasons for this decrease in the poverty rate. One is the increase in labour force participation from 6.9% to 12.5% for this older group, whereas for other age groups labour force participation has remained quite stable.

Another reason is the larger increase in pension rates (which is the typical social security payment for people over 65) compared to allowance rates (which is the typical social security payment for working-age people). From an already high base, the payment rates for the oldest age group clearly increased by the most.

https://datawrapper.dwcdn.net/HOnb1/8/

These two reasons combined account for over 75% of the decrease in poverty incidence. Increased private pensions account for a further large part of the decrease (nearly 41%), while changes in investment income would have increased the poverty rate.

Why pensions are so important

This shows just how important public and private pensions are for the standard of living of older people. Given that more and more people will be covered by superannuation, we expect that poverty rates will further decline in the future. However, maintaining the value of public pensions is equally important as a substantial proportion of people over 65 will remain dependent on these payments.


Read more: How can we prevent financial abuse of the elderly?


Those dependent on the age pension include people with a disability during their working life, and many women, as they remain the ones who are more frequently out of the labour force and working part time to raise children. As a result, these groups have less opportunity to build up sufficient superannuation. However, the age pension may perhaps be better targeted.

Although the largest increases in income support are for those classified as poor (with the largest average increase observed for those over 65), the non-poor population over 65 also receives a substantial increase in income support.

https://datawrapper.dwcdn.net/coOQW/4/

The increase in payments for people who aren’t poor and over 65 is nearly as large as the increase for those classified as poor who are aged 15 to 64. Payments for working-age people have only been increased with inflation, while pensions increased at the same rate as average earnings which has generally been higher than inflation.

The ConversationTo better alleviate poverty for our whole population, government payments for working-age people need to keep up with average earnings like the pensions do. If the government is not prepared to direct more resources to income support payments, they need to treat different age groups more equally. This means better targeting payments among our older population and using any savings to increase payments for the working-age population at a similar rate as pensions.

Guyonne Kalb, Professorial Research Fellow and Director of the Labour Economics and Social Policy Program, University of Melbourne

This article was originally published on The Conversation. Read the original article.

It would cost you 20 cents more per T-shirt to pay an Indian worker a living wage


File 20171207 31528 1pvaxud.jpg?ixlib=rb 1.1
A farmer harvests cotton in Maharashtra, India.
Shutterstock

Murray Ross Hall, The University of Queensland and Thomas Wiedmann, UNSW

If we really care about protecting the people who make the things we wear and use, we need to raise wages for workers in supply chains to above the poverty line. Our research shows that this only requires a 20 cent increase in the Australian retail price for a T-shirt made in India.

This small increase can lift wages by up to 225% in India, closing the living wage gap for the most vulnerable workers in the supply chain, such as cotton farmers. The living wage gap is the difference between a living wage and current wages.


Read more: Explainer: what exactly is a living wage?


The living wage is the income required for a decent standard of living for a worker and their family. It lifts the worker above the poverty line and is defined by the costs to meet basic needs such as food and shelter. It also limits the number of working hours per week required to meet these needs.

A living wage has long been advocated as a way to support vulnerable and exploited workers. About 42% of all workers globally are in insecure jobs and have no social protections, 29% remain in moderate to extreme poverty and about 25 million people are in slavery.

Many of the goods we now buy are part of global supply chains. Since the 1980s the production of labour-intensive products such as textiles and footwear has shifted to countries with low-cost labour.

Cost-cutting often impacts those with the weakest bargaining position, such as cotton farmers – cotton prices have been on a downward trend over the past decade. Without realising it, our demand for low prices can cause vulnerable workers in other countries to work for less than a living wage.


https://datawrapper.dwcdn.net/UuMlS/9/


Our research calculated the living wage gaps in India, broken down by region, gender, skill and type of employment. For instance, female workers on cotton farms in Gujarat earn 207% below the living wage. Casual female workers in Haryana have a living wage gap of about 34%.

It would take on average a 15 cent price increase on T-shirts in Australia to close the living wage gap for cotton workers in India. Adding another five cents would close the living wage gap for Indian textile workers, and also account for the increase in agent fees, which are a percentage of the production costs.

The living wage gap may be larger or smaller on particular farms or factories, but a 20 cent increase on average would be sufficient to lift all Indian workers in the garment supply chain out of poverty.


Read more: Why the fashion industry keeps failing to fix labour exploitation


The small cost to address poverty and climate change for producing a T-shirt in India. Murray Hall.

How we can raise the living wage

The cost to close the living wage gap in developing countries is small because wages for workers in these countries make up only a fraction of the retail price charged in countries like Australia.

Our work shows it costs about A$5.30 to produce a T-shirt in a country like India and ship it to Australia. The remaining costs embedded in a A$25 T-shirt come from warehousing, distribution and retail costs within Australia itself.

As a result, a 20 cent increase represents a less than 1% increase in the Australian retail price. It would cost only another 40 cents to cover the cost of greenhouse gas abatement. This means an ethically made T-shirt would only cost 2.5% more than current prices.


https://datawrapper.dwcdn.net/dSGy3/1/


A roadblock to implementing living wages is simply knowing the source of materials. Only about 7% of fashion companies in Australia know where all of their cotton comes from. Unless an Australian retailer specifies the source of cotton, the decision is made by the overseas textile contractor, often based on price.

Another challenge is that we need an accepted method for calculating and auditing the payment of living wages in the supply chain. The retailer needs to know how much the cotton farmer should be paid and have a system to check it has been done.

Over the past four years consumer pressure has pushed fashion companies to understand their supply chains and to consider paying living wages, but there is still a long way to go.


Read more: What businesses can do to stamp out slavery in their supply chains


In 2012 a group of the world’s largest ethical trade organisations formed the Global Living Wage Coalition.

This organisation has developed a manual for measuring the living wage and requiring? living wages to be paid to their producers. The producers are audited along the supply chain and in return can advertise their compliance with ethical standards. Shoppers will soon be able to look for a label – similar to the Fairtrade symbol – to know that living wages have been paid throughout the supply chain.

The ConversationThe famous economist John Maynard Keynes argued that consumers are not entitled to a discount at the expense of the basic needs of workers. In fact, we only need to pay a small amount more to provide a living wage and make a big difference to the world’s poorest workers.

Murray Ross Hall, PhD Candidate, School of Earth and Environmental Science, The University of Queensland and Thomas Wiedmann, Associate Professor, UNSW

This article was originally published on The Conversation. Read the original article.

‘Successful failures’ – the problem with food banks


File 20171109 14215 1gs7rqe.jpg?ixlib=rb 1.1
Pasta and bolognese sauce were on the menu provided at this Sydney venue by not-for-profit organisation Foodbank.

Nick Rose, William Angliss Institute and Susan Booth, Flinders University

From their inception in the early 1990s, Australian food banks were supposed to be a temporary solution to food poverty.

They have since morphed from “emergency to industry” – lauded for reducing food insecurity and helping to solve the food waste problem by diverting tonnes of produce from landfill.

It’s the ultimate win-win that big food corporations and retailers love: feed the needy and save the planet at the same time. This logic has been enshrined in Canada’s National Food Waste Reduction Strategy and in European laws that require supermarkets to donate surplus produce to charities.

Can foodbanks end food insecurity?

As Martin Caraher has suggested on The Conversation, we argue that food banks “depoliticise hunger” and address symptoms rather than causes.

Laudable and regrettably necessary as their work is, food banks are a band-aid solution for a patient – contemporary society – suffering from what John McMurtry evocatively terms “the cancer stage of capitalism”. We are seeing ubiquitous and intensifying inequality, brought about by decades of dogmatic adherence to market fundamentalism.

If we are serious about tackling the causes of food insecurity, we must turn away from neoliberalism to an inclusive and values-based political economy. And if we are serious about ending food waste, we need a “paradigm shift” away from productivism towards a food system “designed for well-being, resilience and sustainability”.

From emergency to industry

According to Foodbank Australia’s 2017 Hunger Report, 625,000 Australians are seeking emergency food relief every month. That’s a 10% increase on the previous 12 months.

Despite their rapid expansion, food banks are unable to meet the demand produced by stagnating wages, rising costs of living and a shrinking welfare state. They have been called “highly visible successful failures”. As well as stepping into the state’s shoes to provide a minimal social security safety net, they offer very useful services to food manufacturers and retailers.

First, they divert millions of tonnes of waste from landfill. Food donors save considerable sums in disposal charges.

Second, donors receive tax deductions for all produce donated to food banks, which are registered charities. And, perhaps most significantly, donors can enhance their social licence to operate as good corporate citizens and receive cheap publicity into the bargain.

Band-aids, not solutions

In a recent paper for the UK Food Research Collaboration, Martin Caraher and Sinead Furey undertook a cost-benefit analysis of the current consensus that food insecurity is best addressed by increasing donations of surplus food to food banks. Their conclusion was unequivocal:

While there are benefits to diverting surplus food away from landfill, the reasons for pessimism outweigh the reasons for optimism. This is because the benefits of using food waste to feed people accrue primarily to the food industry, whilst absolving responsibility of the government to address food insecurity.

This is of particular concern in a liberal democracy such as Australia that professes to be committed to the principle of universal human rights, including the right to adequate food. Research in the Netherlands and Scotland has confirmed the humiliation, shame and loss of dignity experienced by food bank users.

Dignified access to good food is a fundamental component of the human right to adequate food. Feeding people food waste directly undermines this right.

Reframing the debate

The dominant win-win approach that says we can solve food insecurity by diverting food waste into food banks is patently failing. Both phenomena are increasing. In any case, a state of food security is not achieved via emergency food relief.

A breakthrough was achieved on March 25, 2015, when leading community food organisations and food security researchers in Canada issued the Cecil Street Statement. The statement clarified that food insecurity was due to inadequate income and the solution lay in people having enough money to buy good food in a dignified way. Further, it stated that the conflation of food insecurity with food waste was unhelpful and counterproductive.

In Australia, the Right to Food Coalition last year issued a position statement, The Human Right to Food. This included a detailed set of recommendations, drawing on the work of the United Nations special rapporteur on the right to food.

These recommendations specified the actions required from all levels of government, as well as industry, philanthropical and community organisations. The statement called on the federal government to:

  • adequately finance income support payments so that all Australians can access a weekly basket of healthy foods

  • ensure that initiatives to rebuild local food systems are adequately supported.

What is the solution?

Broadly, what’s needed is a paradigm shift towards sustainable, healthy, resilient and rational food systems. The International Panel of Experts on Sustainable Food Systems (IPES) has clearly articulated the pathways towards such systems.

The principal barriers to such systems, according to the experts, reside in excessive concentration of political and economic power in the hands of mega-food corporations. This is documented in the new IPES report, Too Big to Feed.

The ConversationIn the words of visionary UK economist Kate Raworth, the necessary paradigm shift begins with a reframing of our societal priorities, away from the mantra of “an economy that grows regardless of whether we thrive” and towards “an economy that enables us to thrive regardless of whether it grows”.

Nick Rose, Lecturer, William Angliss Institute and Susan Booth, Casual Academic, College of Medicine and Public Health, Flinders University

This article was originally published on The Conversation. Read the original article.

Clearing homeless camps compounds the violation of human rights and entrenches the problem


Cristy Clark, Southern Cross University

On Wednesday evening, the New South Wales state government passed legislation empowering police to dismantle the Martin Place homeless camp in the heart of Sydney’s CBD. This follows similar actions in Victoria, where police cleared a homeless camp outside Flinders Street Station. Melbourne Lord Mayor Robert Doyle proposed a bylaw to ban rough sleeping in the city.

In March, the UN special rapporteur on the right to housing, Leilani Farha, censured the City of Melbourne’s actions, stating that:

… the criminalisation of homelessness is deeply concerning and violates international human rights law.

As the special rapporteur highlighted, homelessness is already “a gross violation of the right to adequate housing”. To further discriminate against people rendered homeless by systemic injustice is prohibited under international human rights law.


Further reading: Ban on sleeping rough does nothing to fix the problems of homelessness


Real problem is lack of affordable housing

In contrast to her Melbourne counterpart, Sydney Lord Mayor Clover Moore had been adopting a more human-rights-based approach to resolving the challenges presented by the Martin Place camp.

After negotiating with camp organisers, Moore made it clear her council would not disperse the camp until permanent housing was found for all of the residents. As she pointed out:

You can’t solve homelessness without housing — what we urgently need is more affordable housing and we urgently need the New South Wales government to step up and do their bit.

It’s no secret that housing affordability in both Sydney and Melbourne has reached crisis point. And homelessness is an inevitable consequence of this. But we have seen little real action from government to resolve these issues.

The NSW government has been offering people temporary crisis accommodation or accommodation on the outskirts of the city. This leaves them isolated from community and without access to services.

In contrast, these inner-city camps don’t just provide shelter, food, safety and community; they also send a powerful political message to government that it must act to resolve the housing affordability crisis.

Having established well-defined rules of conduct, a pool of shared resources and access to free shelter and food, the Martin Place camp can be seen as part of the commons movement.

This movement seeks to create alternative models of social organisation to challenge the prevailing market-centric approaches imposed by neoliberalism and to reclaim the Right to the City.


Further reading: Suburbanising the centre: the government’s anti-urban agenda for Sydney


We should be uncomfortable

It is not surprising that right-wing pundits have described these camps as “eyesores” or that they make NSW Premier Gladys Berejiklian “completely uncomfortable”. The breach of human rights these camps represent, and the challenge they pose to the current system, should make people uncomfortable.

//platform.twitter.com/widgets.js

//platform.twitter.com/widgets.js

Unlike most comparable nations, Australia has very limited legal protections for human rights. In this context, actions like the Martin Place and Flinders Street camps are one of the few options available to victims of systemic injustice to exercise their democratic right to hold government to account.

In seeking to sweep this issue under the carpet, both the City of Melbourne and the NSW government are not only further breaching the right to adequate housing, they are also trying to silence political protest.

It is clear from Moore’s demands, and the NSW government’s own actions, that the Martin Place camp is working to create pressure for action. What will motivate the government to resolve this crisis once the camps have been dispersed?

As Nelson Mandela argued in 1991 at the ANC’s Bill of Rights Conference:

A simple vote, without food, shelter and health care, is to use first-generation rights as a smokescreen to obscure the deep underlying forces which dehumanise people. It is to create an appearance of equality and justice, while by implication socioeconomic inequality is entrenched.

We do not want freedom without bread, nor do we want bread without freedom. We must provide for all the fundamental rights and freedoms associated with a democratic society.

Mandela’s words were hugely relevant to apartheid South Africa, where a ruling elite had established a deeply racist and unjust system that linked political disenfranchisement and material deprivation. But they also resonate today in Australia where inequality is on the rise – driven in large part by disparities in property ownership.

The ConversationHomelessness is a deeply dehumanising force that strips people of access to fundamental rights. The policies that are creating this crisis must be seen as unacceptable breaches of human rights. We need to start asking whether our current economic system is compatible with a truly democratic society.

Cristy Clark, Lecturer in Law, Southern Cross University

This article was originally published on The Conversation. Read the original article.

Income inequality exists in Australia, but the true picture may not be as bad as you thought


File 20170511 21615 hbimrh
Wealth inequality remains a problem in Australia, but it is lower now than in the years leading up to the GFC.
Flickr/Sacha Fernandez, CC BY-NC-SA

Roger Wilkins, University of Melbourne

We hear a lot about inequality in Australia but the true picture is much more complicated than the headlines usually suggest.

The data indicate that wealth inequality has grown but is lower now than before the global financial crisis (GFC). And while the personal incomes of the very rich have gone up, overall household income inequality has barely shifted since the start of this century.

Economic inequality refers to the extent to which material well-being differs across people – how rich are the rich, how poor are the poor. But there are different ways to be rich, and different ways to be poor.

Income inequality is about the gap between people with high incomes and low incomes. Wealth inequality, on the other hand, looks at the gap between people with high net worth (for example, a lot of houses, stocks or other assets) and people with low net worth (few or no assets). People could have very similar incomes but be at opposite ends of the scale when it comes to their wealth, for example.

In practice, attention typically focuses on income inequality, although it is also important to consider wealth inequality.

Since 2000-01, there have been three key data sources for examining income inequality in Australia: the Australian Bureau of Statistics’ (ABS) Household Income and Wealth surveys, the Household, Income and Labour Dynamics in Australia (HILDA) Survey that the Melbourne Institute has been running since 2001, and the Australian Taxation Office’s tax records data.

The first two can also be used to examine wealth inequality.

For various reasons, the three data sets do not tell exactly the same story about income inequality trends since the beginning of this century. Nonetheless, there are some key conclusions we can draw.

1. The top 1% got richer, faster – but overall household income inequality has barely changed

The first conclusion is that the personal incomes of the very rich have grown somewhat more strongly than the personal incomes of the rest of the population.

For example, data compiled by the World Wealth and Income Database (WID World) show that the share of income going to the top 1% rose from 7.5% in 2000-01 to 9% in 2013-14.


WID World

Despite this increase in inequality of personal incomes at the top, measures of overall inequality of household incomes (as opposed to personal incomes) show relatively little net change this century.

One way to track this is to look at the Gini co-efficient, a commonly used measure of inequality that ranges from zero to one. Zero means total equality, with everyone on the same income. A Gini coefficient of one means complete inequality, the equivalent of one person having all the income.

HILDA survey data show that Australia’s Gini coefficient was 0.303 in 2000-01 and 0.296 in 2014-15. In other words, it has barely shifted.

https://datawrapper.dwcdn.net/rPb7b/2/

The ABS income survey shows a small increase from 0.311 in 2000-01 to 0.333 in 2013-14, but this increase can be attributed to changes made by the ABS between 2003-04 and 2007-08 to the definition and measurement of income:

https://datawrapper.dwcdn.net/1sSSg/2/

Being a longitudinal study, the HILDA Survey also allows us to consider inequality in incomes measured over longer intervals than one year. Incomes can fluctuate from year to year, and so we may get an exaggerated picture of income inequality if we examine only annual income. Some people who appear poor in one year may in fact have high incomes in other years and so, overall, are not really poor.

The HILDA Survey indeed shows that inequality of income measured over five years is lower than inequality of annual income. However, of some concern is that measures of inequality of five-year income have been trending upwards since the early 2000s — although the increase is very slight.

https://datawrapper.dwcdn.net/jCXat/2/

2. Wage inequality has increased

While that’s been happening, however, the labour market has become more unequal.

Wage inequality is typically thought of in terms of inequality in earnings per hour worked, while labour market inequality more broadly could be thought of as inequality in total (annual) earnings across all persons in the labour force.

Wage inequality has steadily risen and, moreover, the share of employment that is part-time has risen. Research published last year showed that the higher your pay relative to others, the more likely you are to get a better pay rise.

https://datawrapper.dwcdn.net/U6pJF/2/

On the surface, it is remarkable that the large rise in labour market inequality has not — at least, not yet — translated to large increases in income inequality.

The reasons for this are complex, but an important contributor has been the relative concentration of employment growth in low-income households.

Another potential reason why increased wage inequality has not translated to increases in income inequality is our system of progressive income taxes and transfers. However, this seems largely to not be the case in the 2000s in Australia, since the tax and transfer system actually became less redistributive (was doing less to reduce income inequality) over this period.

So while the tax and transfer system has probably moderated the effects of increased wage inequality on income inequality, it has not completely neutralised it.

3. Wealth inequality grew – but is lower now than in the years leading up to the GFC

In terms of wealth, both the ABS income surveys and the HILDA Survey indicate that wealth inequality grew strongly in the years leading up to the global financial crisis (GFC).

The HILDA Survey, which has collected detailed wealth data every four years since 2002, shows that the wealth required to be in the top 1% of the wealth distribution increased by 140% in real terms between 2002 and 2006. This was a period in which both house prices and the share market were rising strongly.

However, wealth inequality appears to have moderated slightly since the GFC, with the wealth required to be in the top 1% actually 9% lower in 2014 than in 2006. This appears to primarily derive from weaker share market performance. The ASX200, for example, was approximately 20% below its October 2007 peak in late 2014 (and even now is still over 10% below the peak).

Perception and reality

In light of the minimal changes in overall income inequality this century, and the evidence that wealth inequality is lower now than in the years leading up to the GFC, it is perhaps surprising that public perceptions appear to be that inequality is growing strongly.

Income inequality has grown in the US more sharply than it has in Australia.
World Wealth and Income Database WID World

Perhaps also important is that household income growth in Australia has slowed since 2008-09, and indeed has essentially stalled since 2011-12. In part, this reflects slowing wage growth, but also important has been relatively weak growth in employment, and in particular full-time employment.

For example, the forthcoming HILDA Survey Statistical Report will show that, at December 2015 prices, the median “equivalised” household income – that is, household income adjusted for household size – was A$46,031 in 2011-12 and was still only A$46,007 in 2014-15.

The ConversationThis stagnation in average living standards is arguably likely to lead to greater focus on the fairness of the income distribution.

Roger Wilkins, Professorial Research Fellow and Deputy Director (Research), HILDA Survey, Melbourne Institute of Applied Economic and Social Research, University of Melbourne

This article was originally published on The Conversation. Read the original article.